

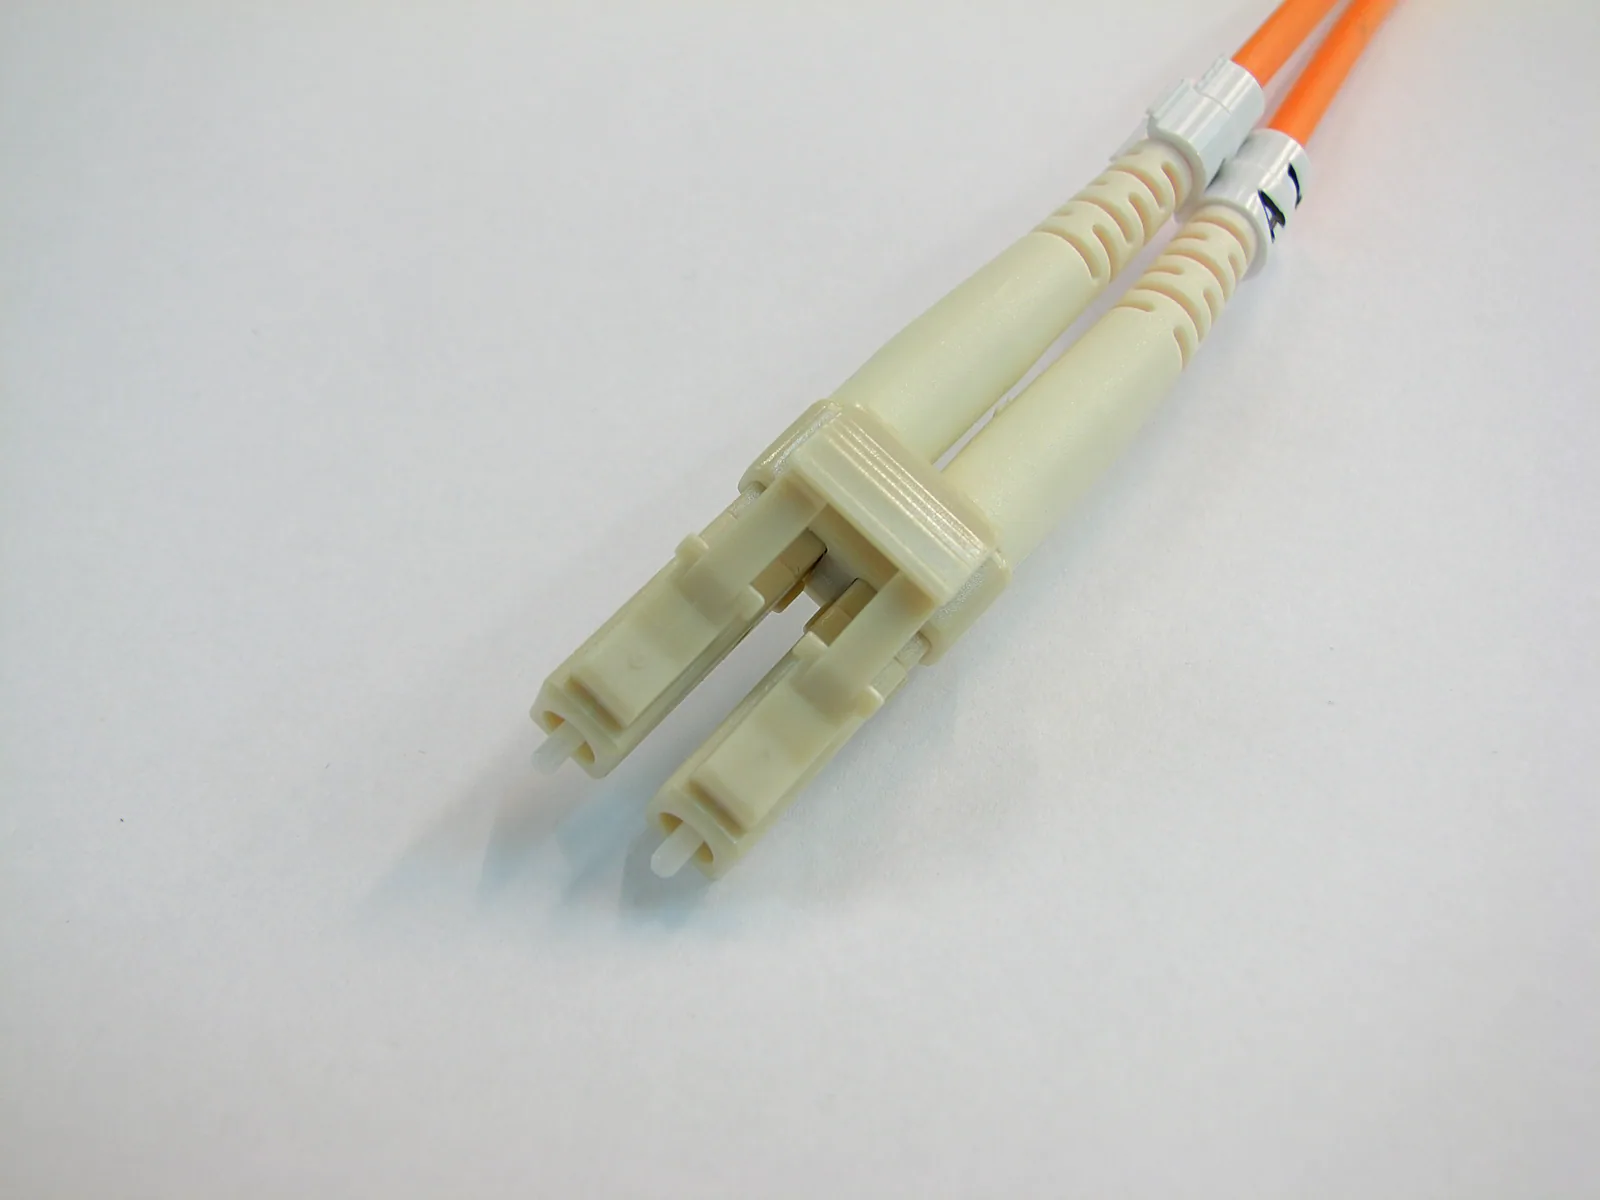
Transmission is below expectations. Where should you inspect next: the input connector, coupling interface, waveguide section or packaged connection path?
End-to-end measurements reveal overall changes but may not locate them. For paths with multiple structures and interfaces, quantifying a change and identifying where to investigate are separate needs.
This distinction helps combine transmission, reflection and spatial diagnostics appropriately rather than expecting one trace to answer everything.
Total Loss Is a Result, Not a Location Label
With defined transmission references, insertion loss describes the optical power change associated with inserting the DUT. It directly supports budgets, sample comparison and quality assessment.
Overall values combine multiple effects. Two samples with similar total loss can have different internal distributions; a worsened result can originate in the device, access or measurement conditions.
Luna distinguishes the physical meanings of IL and RL and emphasizes method, settings and conditions. In particular, backscatter-derived loss and end-to-end power-reference measurements are not unconditionally equivalent just because both use dB.Measurement reference
Abnormal total loss should trigger investigation, not directly label a fault location or defect type.
Spatial Information Adds a Diagnostic Dimension
Optical frequency-domain reflectometry (OFDR) uses a swept source and coherent detection to acquire optical responses, producing spatial distributions with suitable processing and calibration.
Luna describes OFDR reflection/backscatter analysis for distributed loss, polarization-related effects and diagnostics of short links and photonic devices. Spatial information complements overall parameters, with capabilities depending on the instrument and DUT.Application reference
Spatial information allows engineers to prioritize structures near certain events and track changes before and after an intervention instead of inspecting the entire path indiscriminately.
It is not an automatically generated defect list. Event positions and amplitudes require interpretation using ports, reference positions, refractive/group-index assumptions and actual structures.
A Reflection Event Is Not Automatically a Fault
Expected connections and structural transitions can produce responses. A peak does not prove a defect, and a higher peak does not necessarily contribute the most transmission loss.
Conversely, some distributed losses or coupling degradation may not form a distinct reflection peak.
Separate three levels of interpretation:
- What Was Observed? An event appears, moves or changes; a distribution differs from its reference.
- What Might It Represent? A known interface, connection, path change or structure requiring investigation.
- What Would Confirm the Explanation? Controlled interventions, independent measurements, structural inspection or repeat experiments.
Separating observations, hypotheses and confirmation reduces the risk of equating trace features with failure mechanisms.
A More Directed Investigation
For a transmission decrease after coupling or packaging, the following investigation is a method discussion—not a real customer case or a prescribed anomaly magnitude.
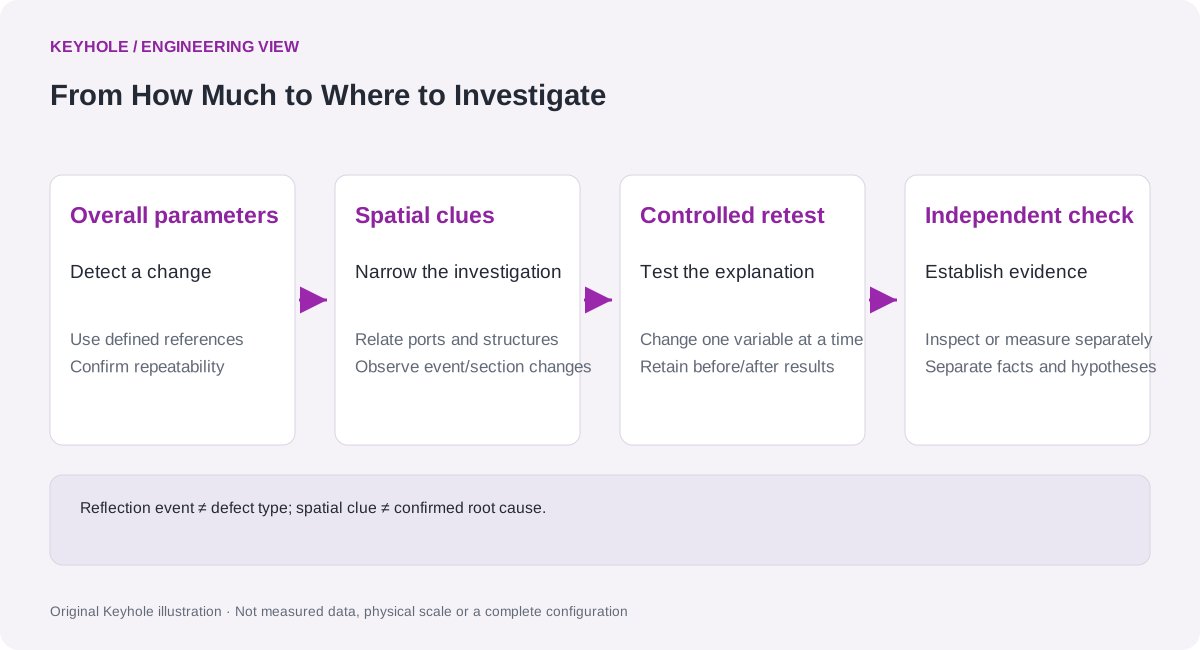
First, Confirm Repeatability of the Overall Change. Keep references and settings consistent to rule out short-term fluctuations or incidental reconnection effects.
Then Relate Spatial Clues to Structures. Map accessible ports, connections and critical interfaces to measurement coordinates; find locations or sections that changed after assembly.
Perform a Controlled Retest. Within operating procedures and safety limits, choose a reversible action such as checking or reconnecting an interface. Avoid changing multiple variables and retain before/after transmission and reflection data.
Finally, Verify the Explanation. Repeatable concurrent changes in spatial response and overall transmission strengthen evidence that an interface is involved. Structural inspection or other independent evidence is still needed to establish the final cause.
The aim is to direct each investigative step—not replace analysis with one scan.
Resolution, Coordinates and Dynamic Range Need Context
Display point spacing, ability to distinguish adjacent events and actual location accuracy are different quantities—not one resolution number.
Sweep span, window functions, SNR and processing affect event appearance. Converting optical delay to physical length also requires propagation parameters. One conversion assumption cannot be applied indiscriminately across fiber, on-chip waveguides and different materials.
Strong reflections, available return signal, coupling loss and instrument range affect visibility of weak events. Before/after comparisons must state whether settings and processing match, not simply compare displayed peak heights.
From Location Clues to Reviewable Evidence
Useful diagnostic records link device/channel IDs, structure maps, reference positions, coordinate-conversion assumptions, settings and before/after data.
Identify direct observations, hypotheses and independently verified findings so other teams can use the evidence for process improvements and quality review.
Keyhole relates overall performance to spatial distributions to narrow investigations. Spatial diagnostics complements—not replaces—end-to-end parameters, high-speed communication testing and final failure analysis.
Further Reading
- Coupling, Packaging and Optical Path Diagnostics Solution
- Fiber Link and Assembly Quality Testing Solution
Editorial note: This article discusses measurement principles and diagnostic reasoning, not third-party performance as Keyhole specifications. OFDR range, event resolution, loss extraction and interfaces depend on model and method; OFDR does not replace eye diagrams, TDECQ, BER or complete failure analysis.