

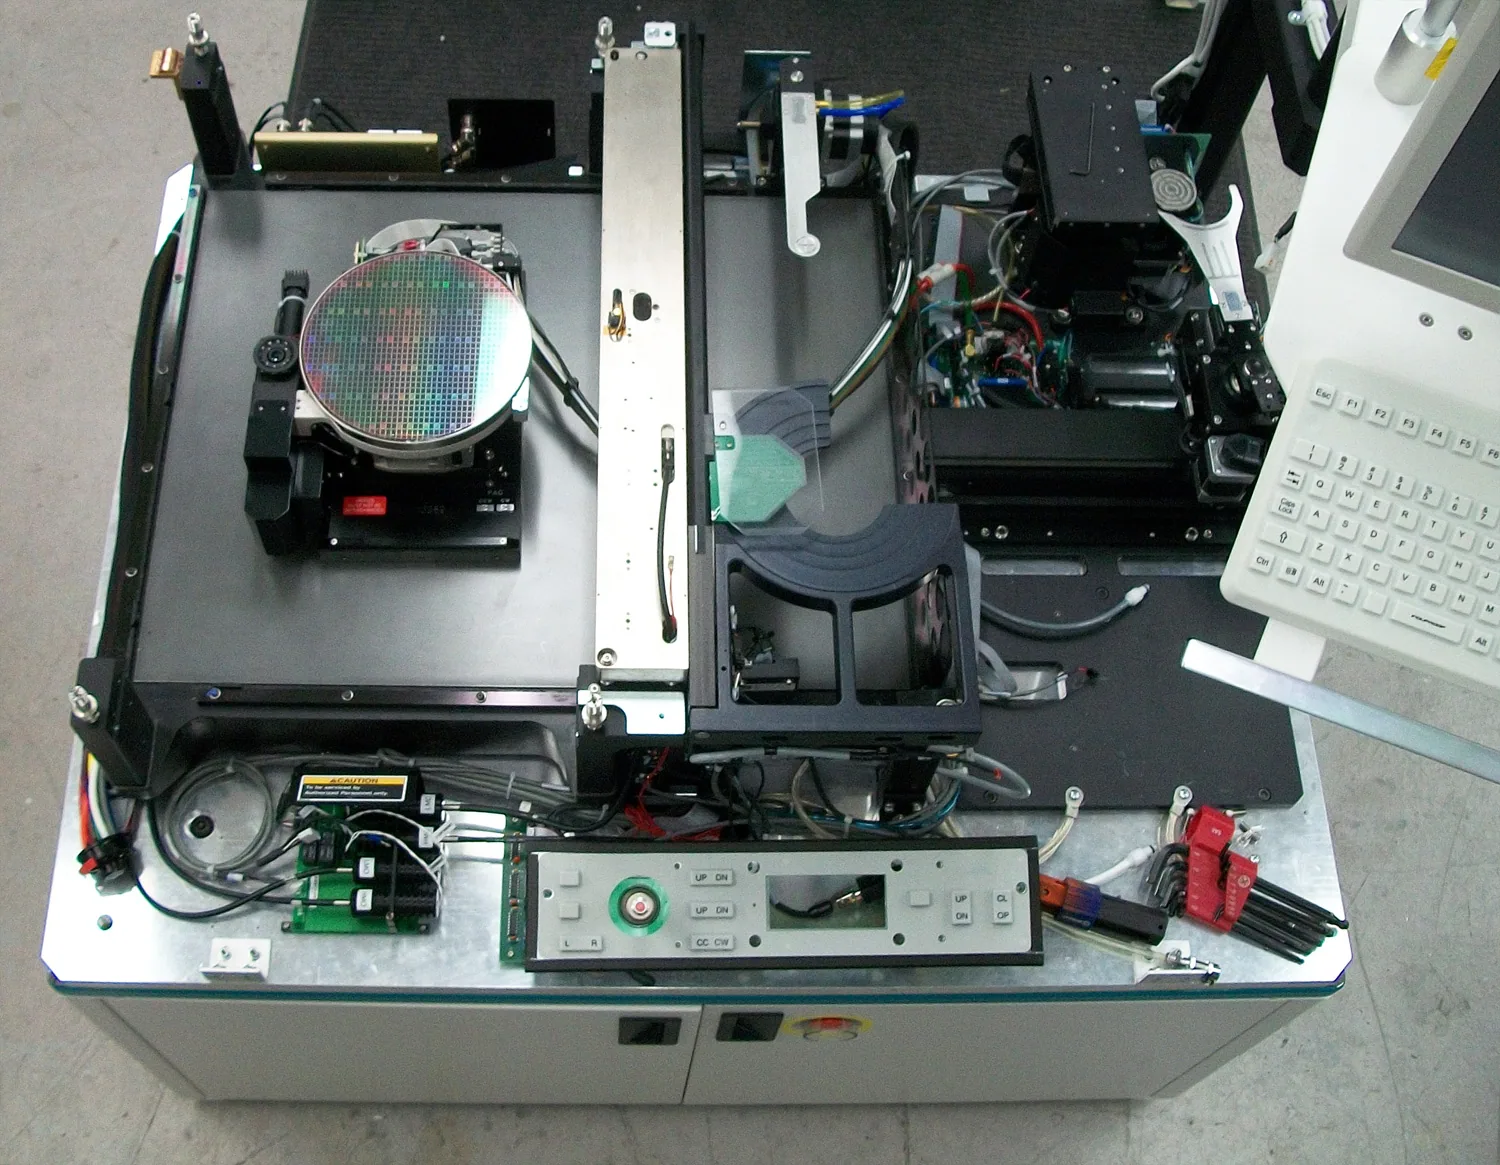
A wafer-test transmission trace is lower than expected. Realigning the coupling improves it, but the trace changes again when measured later.
This is a hypothetical discussion scenario, not a customer case. It raises a practical question: Do the differences belong to the chip or to the measurement process?
Without addressing this first, more measurements may accumulate unexplained data rather than strengthen conclusions.
The Reading Belongs to the Entire Measurement Path
Detected light has passed through the source, input connections, input coupling, DUT, output coupling and receiving path. Polarization, temperature and electrical operating state may also matter.
Low raw power first indicates low transmission through the current path—not necessarily an on-chip waveguide anomaly. Reference conditions and access-path effects must be understood before attributing performance to the device.
Keysight's on-wafer electro-optical application note emphasizes moving calibration reference planes to the DUT interface and accounting for fixtures and connections. Specific calibration/de-embedding procedures must match the measurement type rather than be copied unchanged.Application note
Alignment Errors and Drift Can Make One Device Look Different
Optical access is not merely a connection. Position, angle and mode-field matching affect power entering and leaving the chip.
FormFactor notes that vibration, drift and thermal expansion change coupling efficiency and complicate repeat measurements. Stable coupling affects both signal strength and comparability.Technical reference
Power improvement after realignment does not prove the chip is fault-free. It shows that access conditions influenced the result. Device defects and coupling errors can coexist.
Maximum Power Is Not Always the Right Test Condition
Maximizing transmitted power is common in R&D, but the maximum alone may not be sufficient for sample comparison, process analysis or polarization-dependent characterization.
Changing position and polarization together makes their contributions hard to separate. If each sample uses a different optimum, confirm that those conditions fit the intended comparison.
Define the measurand first, then decide which conditions to fix, scan or optimize. Record both optimization and final conditions.
Not every test needs the same polarization state or alignment algorithm; the method must support the conclusion.
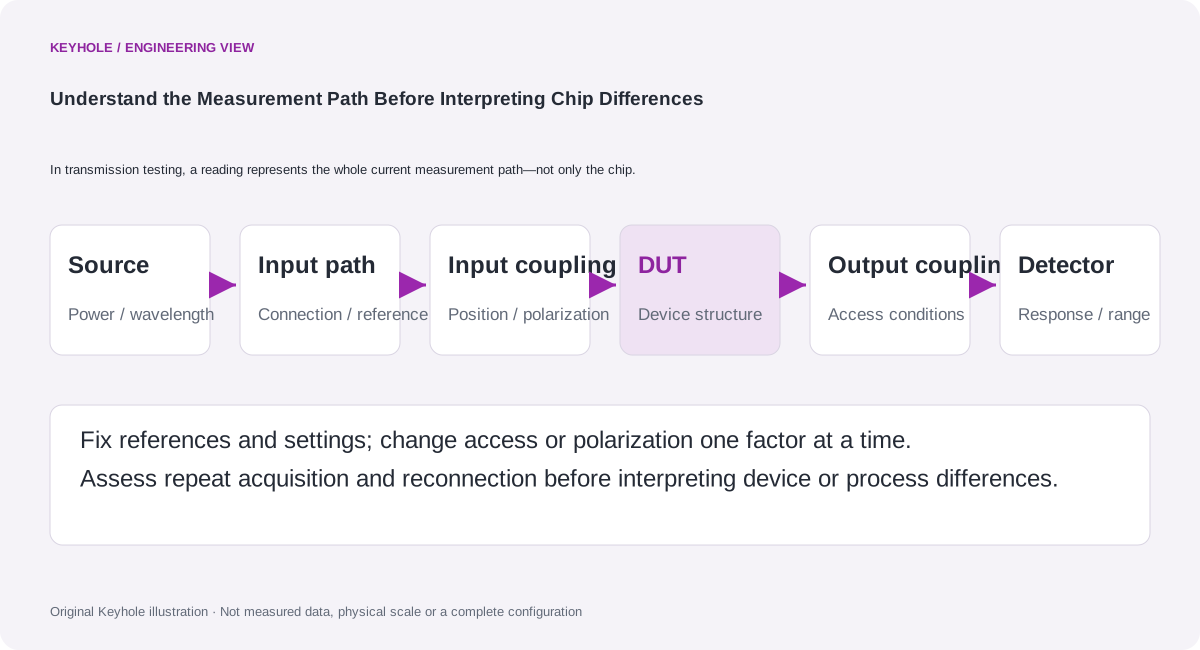
Use Controlled Comparisons, Not One Trace, to Investigate
The following approach can narrow an anomaly. It is not a universal diagnostic standard; operations must comply with device safety and system limits.
Step 1: Check Whether the Reference Is Still Valid. Check the source, connections, reference sample/structure and power range. When and under what conditions was the reference established? Have connections or configurations changed since?
Step 2: Repeat Without Changing Optical Access Where Possible. Observe short-term variation under the same conditions before treating instrument or path fluctuations as sample differences.
Step 3: Treat Reconnection as a Separate Variable. Where permitted, repeat coupling or reconnection and assess its influence. Change one factor at a time where possible.
Step 4: Compare Reference Structures, Adjacent Devices or Other Ports. The aim is not to find a necessarily perfect reference but to add interpretable controls. Shared changes suggest shared conditions; stable object-specific differences warrant investigation of that object.
Step 5: Add Other Measurement Dimensions. Where applicable, combine spectral shape, reflections and spatial clues to assess which explanation best fits the evidence.
Controls narrow the problem; one observed change does not establish a final root cause.
Which Records Make Results Reviewable?
Useful records include more than traces and device IDs: optical access, bands, references, coupling, polarization, temperature and any reconnection or reoptimization.
When comparing positions on a wafer, consider test order and time. Time-dependent drift can be confounded with spatial variation; do not immediately interpret the pattern as a process distribution.
The purpose is not paperwork but enabling another engineer to judge whether two datasets address the same question.
Establish Measurement Credibility Before Interpreting Chip Differences
Evaluate repeated measurements, reconnection repeatability and long-term stability alongside single-measurement accuracy, relative to the differences being investigated.
If the target device difference is smaller than the method's stable discrimination capability, defer process conclusions. Improve access, references and measurement procedures before expanding screening.
Keyhole's approach is to understand the measurement path before attributing device behavior. Separating coupling and chip effects supports a more reliable decision than quickly labeling an anomaly.
Further Reading
- Silicon Photonic Wafer and Chip Test Solution
- Optical Component Spectral and Polarization Characterization Solution
- Next in this series:Total Loss Shows How Much—How Can You Determine Where?
Editorial note: This is an investigative approach, not a universal pass threshold. Alignment, references, polarization control and spatial methods require device-specific and method-specific validation.